Introducing Anomagram - An Interactive Visualization of Autoencoders, Built with Tensorflow.js

Across many business use cases that generate data, it is frequently desirable to automatically identify data samples that deviate from “normal”. In many cases, these deviations are indicative of issues that need to be addressed. For example, an abnormally high cash withdrawal from a previously unseen location may be indicative of fraud. An abnormally high CPU temperature may be indicative of impending hardware failure. This task of finding these anomalies is broadly referred to as Anomaly Detection, and many excellent approaches have been proposed (Clustering based approaches, Nearest Neighbors, Density estimation etc). However, as data become high dimensional, with complex patterns, existing approaches (linear models which mostly focus on univariate data) can be unwieldy to apply. For such problems, deep learning can help.
Why Anomagram? UX Goals
As ML becomes increasingly relevant to many business problems, it is important to create accessible interfaces that enable non-ML experts (citizen data scientists, software developers, designers etc) to experiment with ML models, and with as little overhead as possible. Anomagram is designed as part of a growing area interactive visualizations (see Neural Network Playground [3], ConvNet Playground, GANLab, GAN dissection, etc) that help communicate technical insights on how deep learning models work. It is entirely browser based, implemented in Tensorflow.js, no installations required. Importantly, Anomagram moves beyond the user of toy/synthetic data and situates learning within the context of a concrete task (anomaly detection for ECG data). The overall user experience goals for Anomagram are summarized as follows.
Goal 1:
Provide an introduction to Autoencoders and how they can be applied to the task of anomaly detection.
This is achieved via the introduction module. This entails providing definitions of concepts (reconstruction error, thresholds etc) paired with interactive visualizations that demonstrate concepts (e.g. an interactive visualization for inference on test data, a visualization of the structure of an autoencoder, a visualization of error histograms as training progresses, etc).
Goal 2:
Provide an interactive, accessible experience that supports technical learning by doing.
This is mostly accomplished within the train a model module and is designed for users interested in additional technical depth. It entails providing a direct manipulation interface that allows the user to specify a model (add/remove layers and units within layers), modify model parameters (training steps, batchsize, learning rate, regularizer, optimizer, etc), modify training/test data parameters (data size, data composition), train the model, and evaluate model performance (visualization of accuracy, precision, recall, false positive, false negative, ROC etc metrics) as each parameter is changed.
Dataset (ECG5000) and Task
Anomagram focuses on exploring how an autoencoder can be used for anomaly detection. The prototype uses the ECG5000 dataset which contains 5000 examples of ECG signals from a patient. Each data sample, which corresponds to an extracted heartbeat containing 140 points, has been labelled as normal or being indicative of heart conditions related to congestive heart failure. Given an ECG signal sample, the task is to predict if it is normal or abnormal. ECG5000 works well for a few reasons --- it is visual (signals can be visualized easily) and it is based on real data associated with a concrete use case (heart disease detection). While the task itself is not extremely complex, the data is multivariate (140 values per sample which allows us demonstrate the value of a deep model), but small enough to train in the browser.
The rest of this post assumes some familiarity with the basic concept of Autoencoders and how they can be applied for Anomaly Detection. The explainer section of the Anomagram prototype includes additional background information
Interface Affordances and Insights
This section discusses some explorations the user can perform with Anomagram, and some corresponding insights.
Craft (Adversarial) Input
Anomalies by definition can take many different and previously unseen forms. This makes the assessment of anomaly detection models more challenging. Ideally, we want the user to conduct their own evaluations of a trained model e.g. by allowing them to upload their own ECG data. In practice, this requires the collection of digitized ECG data with similar preprocessing (heartbeat extraction) and range as the ECG5000 dataset used in training the model. This is challenging. The next best way to allow testing on examples contributed by the user is to provide a simulator --- hence the *draw your ECG data *feature. This provides an (html) canvas on which the user can draw signals and observe the model's behaviour. Drawing strokes are converted to an array, with interpolation for incomplete drawings (total array size=140) and fed to the model. While this approach has limited realism (users may not have sufficient domain expertise to draw meaningful signals), it provides an opportunity to craft various types of (adversarial) samples and observe the model's performance.
Insights
The model tends to expect reconstructions that are close to the mean of normal data samples.
 examples of input data and observe model predictions/performance.")
Visually Compose a Model
 examples of input data and observe model predictions/performance.")
Users can intuitively specify an autoencoder architecture using a direct manipulation model composer. They can add layers and add units to layers using clicks. This architecture is then used to specify the model's parameters each time the model is compiled. This follows a similar approach used in "A Neural Network Playground"[3]. The model composer connector lines are implemented using the leaderline library. Relevant lines are redrawn or added as layers are added or removed from the model.\
Insights
There is no marked difference between a smaller model (1 layer) and a larger model (e.g. 8 layers) for the current task. This is likely because the task is not especially complex (a visualization of PCA points for the ECG dataset suggests it is linearly separable).
Users can visually compose the autoencoder model --- add remove layers in the encoder and decoder. To keep the encoder and decoder symmetrical, add/remove operations on either is mirrored.
Effect of Learning Rate, Batchsize, Optimizer, Regularization
The user can select from 6 optimizers (Adam, Adamax, Adadelta, Rmsprop, Momentum, Sgd), various learning rates, and regularizers (l1, l2, l1l2).\
Insights
Adam reaches peak accuracy with fewer steps compared to other optimizers. Training time increases with no benefit to accuracy as batchsize is reduced (when using Adam). A two-layer model will quickly overfit on the data; adding regularization helps address this to some extent. Try them out!
Effect of Threshold Choices on Precision/Recall
Anomagram discusses the necessity of metrics such as precision and recall and why accuracy is not enough. To support this discussion, the user can visualize how threshold choices impact each of these metrics.\
Insights
As threshold changes, accuracy can stay the same but precision and recall can vary. The threshold is a lever the analyst can use to reflect their precision/recall preferences.
Depending on the use case, the choice of threshold can be used to reflect precision/recall tradeoff preferences.
Effect of Data Composition
We may not always have labelled normal data to train a model. However, given the rarity of anomalies (and domain expertise), we can assume that unlabelled data is mostly comprised of normal samples. Does model performance degrade with changes in the percentage of abnormal samples in the dataset? The train a model section, you can specify the percentage of abnormal samples to include when training the autoencoder model.
Insights
We see that with 0% abnormal data, the model AUC is ~96%. At 30% abnormal sample composition, AUC drops to ~93%. At 50% abnormal data points, there is just not enough information in the data that allows the model learn a pattern of normal behaviour. It essentially learns to reconstruct normal and abnormal data well and mse is no longer a good measure of anomaly. At this point, model performance is only slightly above random chance (AUC of 56%).
Conclusion
In this prototype, we have considered the task of detecting anomalies in ECG data. We used an autoencoder and demonstrate some fairly good results with minimal tuning. We have also explored how and why it works. This and other neural approaches (Sequence to Sequence Models, Variational Autoencoders, BiGANs etc) can be particularly effective for anomaly detection with multivariate or high dimensional datasets such as images (think convolutional layers instead of dense layers).
Note: A deep learning model is not always the best tool for the job. Particularly, for univariate data (and low dimension data) , autoregressive linear models (linear regression, ARIMA family of models for time series, etc), Clustering (PCA etc, KMeans), Nearest Neighbour (KNNs) can be very effective. It is also important to note that the data used here is stationary (mean and variance do not change with time), and has been discretized (a typical ECG time series chunked into slices of 140 readings, where each slice constitutes a sample in the dataset). To apply an autoencoder (and other deep learning models) for anomaly detection it is often necessary to first handle stationarity (if it exists) and construct an appropriate dataset (this process may require domain knowledge to correctly discretize data). Interested in learning more about other deep learning approaches to anomaly detection? My colleagues and I cover additional details on this topic in the upcoming Fast Forward Labs 2020 report on Deep Learning for Anomaly Detection.
In a follow up post, I talk about some of the design decisions, implementation details and optimizations I explored in creating Anomagram.
If you have tried Anomagram and find it useful ... feel free to share feedback!
Twitter: @vykthur.
 Designing Anomagram
 2023 Year in Review
 Top 10 Machine Learning and Design Insights from Google IO 2021
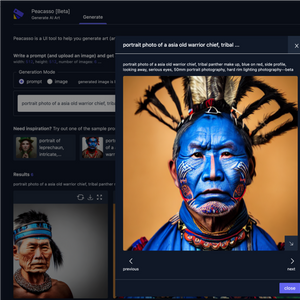 Introducing Peacasso: A UI Interface for Generating AI Art with Latent Diffusion Models (Stable Diffusion)
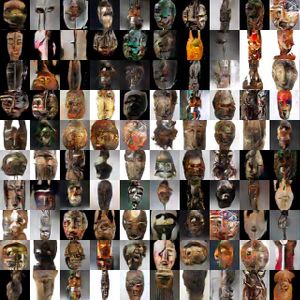 ART + AI — Generating African Masks using (Tensorflow and TPUs)
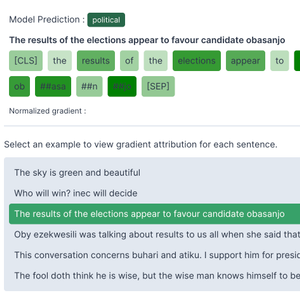 How to Implement Gradient Explanations for a HuggingFace Text Classification Model (Tensorflow 2.0)
 2021 Year in Review